Service sector slowdown explained
- February 7, 2016
- / Shannon Nickinson
- / economy

Accolades keep piling up for Pensacola as a tourism destination, thanks in part to events like Bands on the Beach. Photo credit: Visit Pensacola
In the Pensacola metro area the tourism “slowdown” is really just a “breather” in the rate of increase.
Bloomberg Business reported on Feb. 3 that the Institute for Supply Management’s non-manufacturing index expanded at its slowest rate since 2014. The index covers industries including utilities, retail, health care and tourism.
Service industries expanded in January at the slowest pace in nearly two years, raising the risk that persistent weakness in manufacturing is starting to creep into the rest of the U.S. economy.
The Institute for Supply Management’s non-manufacturing index fell last month to 53.5, the lowest since February 2014, from 55.8, the Tempe, Arizona-based group’s report showed on Wednesday. Readings above 50 signal expansion. The result was less than the 55.1 median forecast in a Bloomberg survey.
“Manufacturing weakness seems to be spreading to the services side of the economy,” said Thomas Costerg, a senior U.S. economist at Standard Chartered Bank in New York. “There’s definitely no decoupling here. It’s a shaky outlook.”
Dr. Rick Harper, associate vice president for research and economic opportunity at the University of West Florida, noted this phenomenon was on the way earlier this year.
“It is a shrinkage in growth rates, rather than a loss of jobs,” Harper says.
Harper explains in four charts:
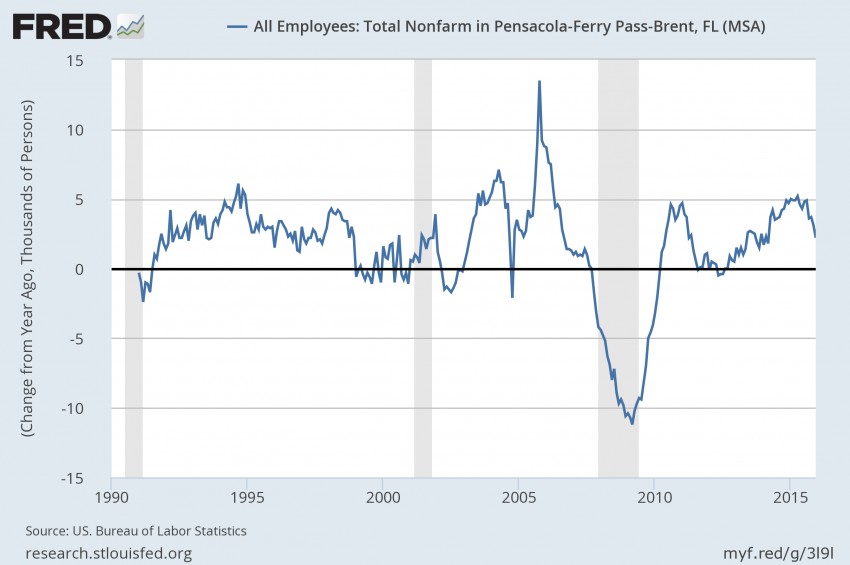
The first chart stretches back to 1991 and shows that job growth for the two-county metro has averaged just over 1,500 per year over that time.
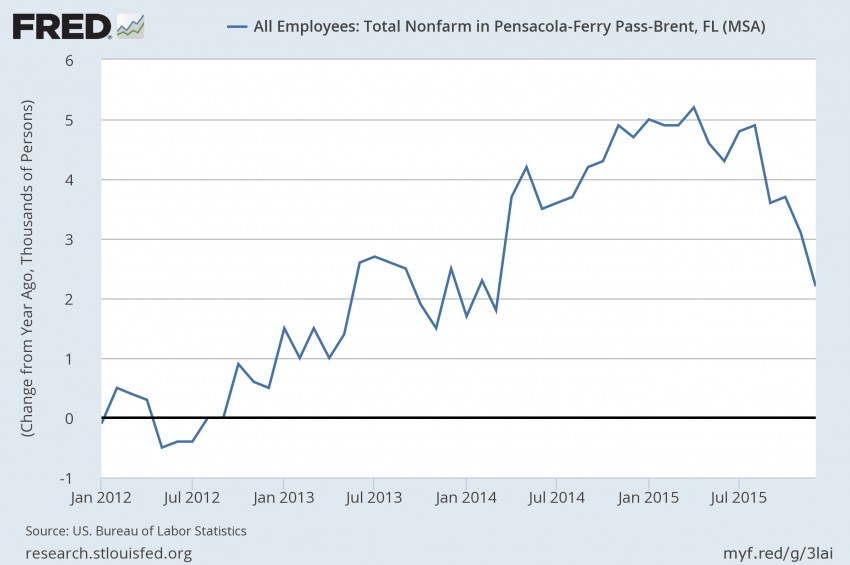
The second chart, which shows year over year growth from January 2012 until December 2015, shows that our most recent month, December 2015, is 2200 jobs above December 2014, but it can easily be seen that the growth rate has slowed down in the most recent months.
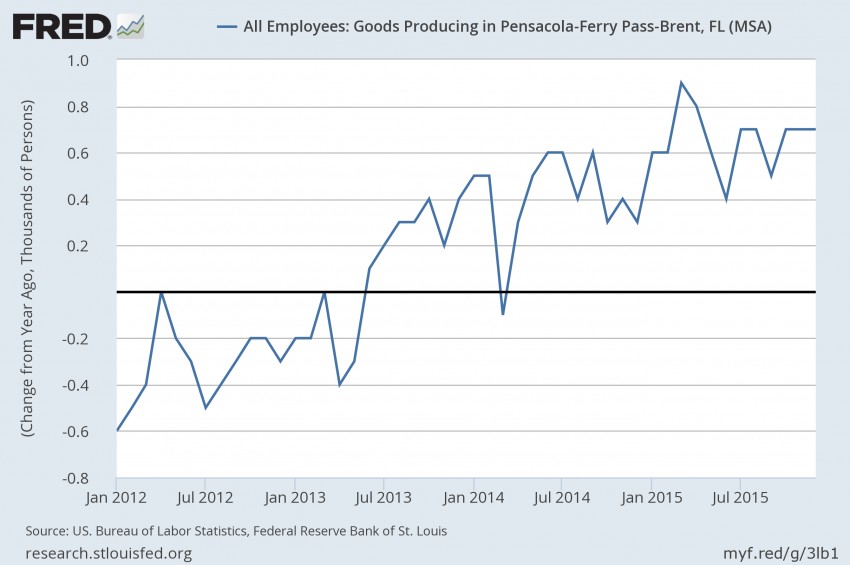
The last two charts show the shorter term picture in goods-producing and in service-providing jobs.
Goods producing jobs growth chart 2012-2015.
And service producing jobs from 2012-2015.
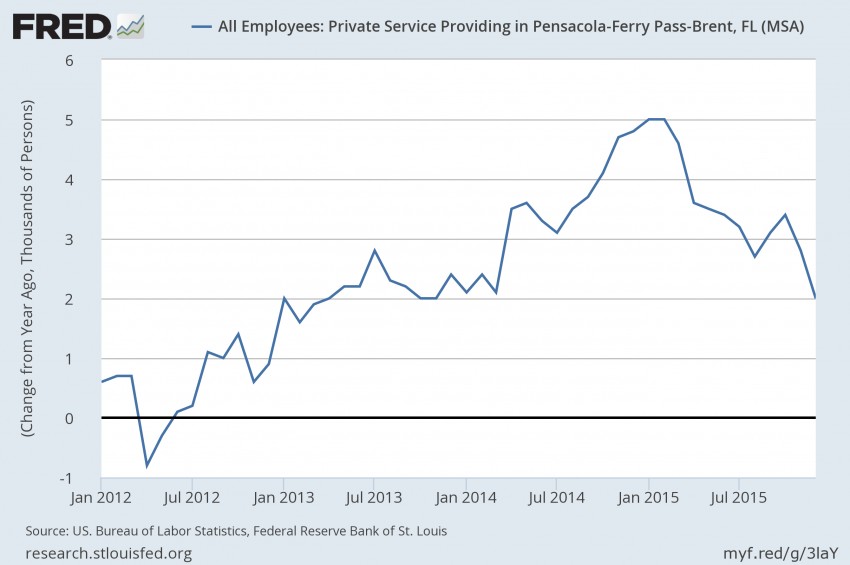
Service producing job growth chart 2012-2015.
"It is the slowdown in growth in service-providing jobs that is most important," Harper says. "First, because good-providing jobs in December 2015 were only 11.6 percent of total non-farm employment, and second, because the slowdown is in service-providing jobs, as they have gone from an annual rate of 5,000 job growth year over year in early 2015 to 2,000 job growth year over year in late 2015."
Recent Posts
-
 CivicCon launches with a look at good growth in cities
-
 Building stronger brains one baby, one parent at a time
-
 SCI debuts commercial on Early Learning City
-
 Entrecon: World class speakers and an opportunity to sharpen skills
-
 PYP Quality of Life survey 2017
-
 EntreCon Pensacola 2016: A look back
-
 Leadership tip: getting better employee takeaways
-
 Leadership tip: be interested instead of interesting
-
 Leadership tip: delivering difficult messages
-
 Brain Bags boost Arc, Early Childhood Court programs