Stormwater survey: Show me the money
- September 30, 2014
- / Shannon Nickinson
- / government
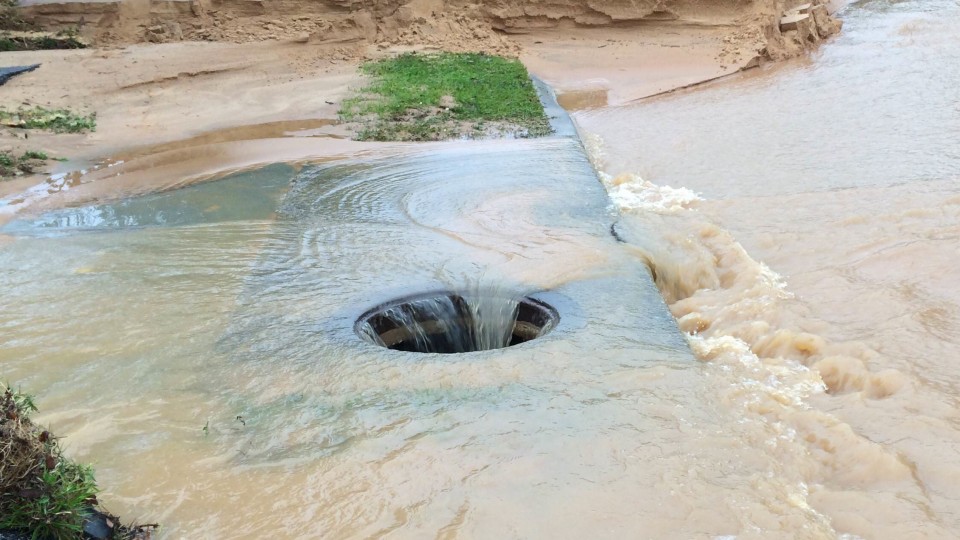
While many Escambia County residents say the flooding of April 29-30 highlighted critical deficiencies in the area’s stormwater infrastructure, consensus on paying for improving that system is harder to come by.
The Escambia County public information office is conducting a series of online surveys related to projects that could be funded by an extension of the local option sales tax.
Voters in November will be asked to extended the one-cent sales tax, which has funded a plethora of traffic, public safety, parks and recreation, roads and infrastructure projects since its inception.
After the April flooding, stormwater was front and center in the public imagination, so much so that county staff re-ordered projects in the current iteration of local option sales tax projects to address some of those concerns.
Over the next three years, Escambia County will spend an additional $17 million adding retention ponds, shoring up earthen dams and installing underground pipes in neighborhoods.
While those who responded to the surveys named stormwater as a critical issue, only 14 percent of those who responded said they would pay for non-traditional stormwater management solutions if using them meant higher taxes or forgoing other public projects such as roads, parks or public safety.
Read the survey results here:
Envision Escambia 2028: Stormwater Drainage
Question #1: First, tell us little about yourself. Where do you live?
Twenty-eight percent of respondents to our third survey live north of Nine Mile Road, with almost 22 percent living between Cantonment and the Alabama state line. Over 17 percent of those who answered the survey lived south of SR 98 and west of Navy Boulevard to Innerarity. Nearly 11 percent lived in the area bounded by Palafox on the east, New Warrington Road on the west, Fairfield Drive on the north and Pensacola Bay on the south. Residents from Perdido Key and those living south of Interstate 10, north of Brent Lane/Bayou Boulevard and between U.S. 29 and Escambia Bay each represented almost nine percent of respondents. Residents in the following areas each represented just over 6.5 percent of those who took the survey: east of Pine Forest/south of I-10/west of Pensacola Boulevard/north of Michigan Avenue, south of Michigan Avenue/north of Cervantes/between Palafox and US 90, and east of Palafox/south of Bayou Boulevard/between Escambia Bay on the east and Pensacola Bay on the south. Residents of Downtown Pensacola comprised 4.35 percent of respondents. Residents living south of I-10, west of Pine Forest and north of Saufley Field Road were approximately two percent of those who answered the survey. Pensacola Beach was unrepresented.
Question #2: How often do you experience standing water or ponding in your neighborhood?
Every time it rains. = 22.22 percent
Sometimes, if it has been raining frequently = 15.56 percent
Rarely, only if it’s a major storm event = 35.56 percent
Never, I do not experience standing water or ponding in my neighborhood = 20 percent
Question #3: Have you ever experienced flooding in your home as a result of a weather event?
Yes = 28.89 percent
No = 71.11 percent
Question #4: Please share with us the location of flooding and the severity of the flood damage as a result of a weather event. If you have never experienced flooding in or around your property, please select N/A.
Flooding in the driveway or lawn/yard.
- No Damage = 0 percent
- Minor Clean Up = 63.64 percent
- Severe Damage = 27.27 percent
- Total Loss = 9.09 percent
- N/A = 0 percent
Flooding inside the garage.
- No Damage = 9.09 percent
- Minor Clean Up = 54.55 percent
- Severe Damage = 36.36 percent
- Total Loss = 0 percent
- N/A = 0 percent
Flooding that reached inside the house or residence.
- No Damage = 8.33 percent
- Minor Clean Up = 25 percent
- Severe Damage = 58.33 percent
- Total Loss = 8.33 percent
- N/A = 0 percent
Question #5: Stormwater management refers to engaging in practices to divert and/or store rainfall to protect property during periods of inclement weather. Between 2006 and 2014, Escambia County has used $45 million of Local Option Sales Tax funds to enhance and improve storm water systems throughout the County. Between now and 2017, an additional $17 million of Local Option Sales Tax will be spent on stormwater drainage. Please select which most accurately expresses your opinions regarding these statements.
In the event of a 25-year flood, Escambia County drainage systems are designed to keep water in pipes, ponds and outfalls. An example of this type of an event was given as several days with heavy, periodic rain.
In the event of a 100-year flood, Escambia County drainage systems are designed to divert water away from homes and force it to flow down the streets to bodies of water. Examples of recent 100-year flood events were given as April 2009 and June 2012.
Given these examples, almost 42 percent of survey respondents said they felt that Escambia County drainage systems perform as designed in the event of a 25-year flood, while 58 percent said they felt it performed under design expectations. When asked about the County’s storm water drainage system performance in a 100-year flood, 21 percent of respondents said they thought it performed to design expectations and 78.5 percent said they performed under expectations.
Question #5: Escambia County cannot responsibly finance a storm water drainage system that would not see breaches in the event of a 500-year flood like the April 29-30 event.
I agree. There is a reduced cost to benefit ratio, and that it is not financially possible to guard against all disasters = 38.10 percent
I disagree. It is important to protect as many people as possible from all possible outcomes = 38.10 percent
Additional feedback included:
- “Doesn't matter how much money you spend if drainage lacks common sense.”
- “It is completely possible to significantly reduce property damage through responsible and appropriate stormwater management.”
- “You can not always predict and be prepared for all natural disasters such as the April 29-30 flooding that occurred in Pensacola. Creeks & drainage ponds overflowing was unexpected to say the least.”
- “I agree that the April 29-30 event was unprecedented; however, continuous repetitive loss structures should be examined and expanding mitigation beyond the immediate area should be examined.”
Question #6: When it rains, water must go somewhere. Traditional stormwater management design has been focused on collecting stormwater in piped networks and transporting it off site as quickly as possible, either directly to a stream or river, or to a large stormwater management facility or basin. Water can also be diverted into a retention pond. Which of these methods, if any, do you feel is most effective?
Sixty-four percent of survey respondents felt that piped stormwater drainage systems were either very effective or effective and almost 24 percent said piped systems were somewhat effective. Almost 48 percent thought that construction of curbs and gutters was most effective, with an additional 40 percent saying they felt curbs and gutters were at least somewhat effective. Use of drainage ditches was thought to be somewhat effective to very effective by 76 percent of those who responded to the survey, while 80 percent felt retention ponds to be somewhat effective or higher.
Question #8: On July 14, David Wagonner - an architect who helped develop the Greater New Orleans Urban Water Plan - spoke to residents at a joint City/County meeting on storm water drainage issues. His vision on stormwater management focuses on approaches that rely less on pumping systems and more on integrating water into the infrastructure. With that in mind, what do you think are some of the best ways to improve our storm water systems? You may select more than one answer.
59.52 percent chose “Integrate water features into parks that will also serve as retention ponds.”
59.52 percent chose “Require more pervious areas in new residential and commercial developments.”
57.14 percent chose “Encourage construction of green features in neighborhoods.”
52.38 percent chose “Replace underground pipes to increase the amount of water these systems are able to carry.
26.19 percent chose “Build more retention ponds, but fence them in to protect children and others from drowning and other hazards.”
Nearly 43 percent offered other suggestions. Among them:
- “Install drainage infrastructure (sic) before installing paved roads.”
- “Maintaining our current drainage infrastructure so that it does not become clogged or blocked with sediment or yard waste.”
- “We do not need any more retention ponds. The ones currently in place are effective, except in cases of exception such as the unusual flood in April 2014 or a hurricane, and retention ponds increase mosquitoes.”
- “I think it would benefit us to hold on to our water and let it clean naturally before it flows into a large body of water.”
- “Establish a plan to gradually shift from pipes and ponds towards a more natural stormwater plan that reduces unnecessary impervious area and keeps water closer to the location it originates.”
- “I believe in a more nature centered approach to drainage. Less piping and more natural features such as the rain gardens idea.”
Question #9: If you selected any of the answers in the previous question, would you still support those efforts if doing so would come at an increased cost to residents and businesses either in terms of higher taxes or other public projects (such as roads, parks or public safety) not being completed?
Yes, I would support efforts to enhance integrated water infrastructure no matter what the cost = 14.29 percent
No, I would not support anything that raises my taxes or causes loss of service in other areas = 19.05 percent
The best approach would be a combination of the two = 40.48 percent
- “Drainage should be top priority due to the increased frequency of flood events over the past few years.”
- “Stop allowing subdivisions to be build in low lying areas (swamp lands).”
- “I would rather see LOST money used for stormwater projects versus additional parks, libraries, or new fire stations.”
- “A compromise would be the best approach but special projects may require temporary funding measures which I may support.”
To add your voice attend one of these public meetings:
- Oct. 6, 5:30 p.m. at Ransom Middle School, 1000 W. Kingfield Road.
- Oct. 7, 5:30 p.m. at Charity Chapel, 5820 Montgomery Ave.
- Oct. 14, 5:30 p.m. at Brownsville Community Center, 3100 W. DeSoto St.
- Oct. 16, 5:30 p.m. at Perdido Bay Community Center, 13660 Innerarity Point Road.
- Oct. 20, 5:30 p.m. at Hillcrest Baptist Church, 800 Nine Mile Road.
- Oct. 23, 5:30 p.m. at Jim Bailey Middle School, 4110 Bauer Road.
- Oct. 28, 6 p.m. at Pensacola Beach Community Church, 918 Panferio Drive.
Recent Posts
-
 CivicCon launches with a look at good growth in cities
-
 Building stronger brains one baby, one parent at a time
-
 SCI debuts commercial on Early Learning City
-
 Entrecon: World class speakers and an opportunity to sharpen skills
-
 PYP Quality of Life survey 2017
-
 EntreCon Pensacola 2016: A look back
-
 Leadership tip: getting better employee takeaways
-
 Leadership tip: be interested instead of interesting
-
 Leadership tip: delivering difficult messages
-
 Brain Bags boost Arc, Early Childhood Court programs